Typing Speed Percentile Chart (168,960 Typists)
By Mark Fulton ·
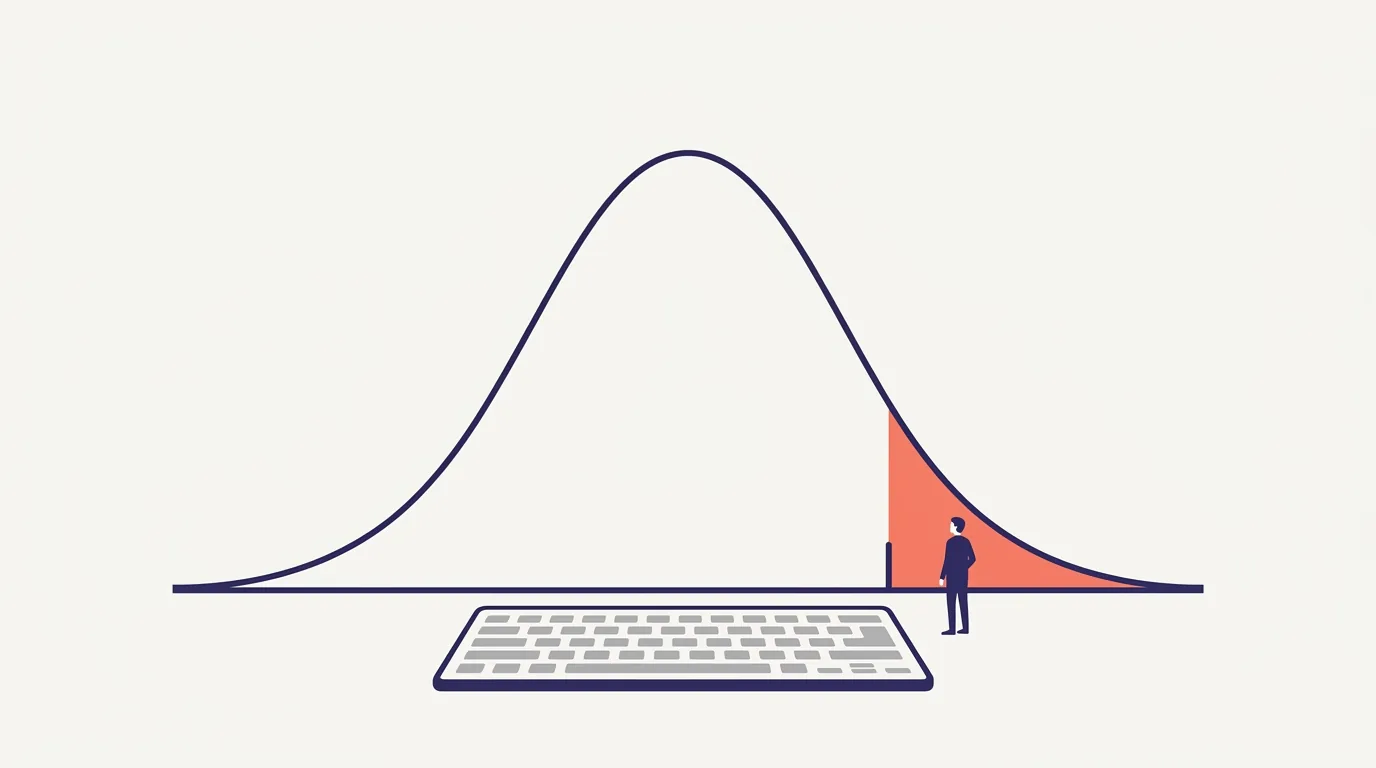
If you type around 50 WPM you are sitting close to the middle of the pack. Roughly 78 WPM puts you in the fastest 10%, and about 26 WPM marks the slowest 10%. Those three numbers are not estimates: they are reported directly in the largest public measurement of modern typing, 136,857,600 keystrokes from 168,960 volunteers, published by Aalto University and the University of Cambridge at CHI 2018. Almost every other percentile you will find online, including the ones broken out to a single decimal by age and gender, was never measured. It was guessed, and the guesses do not agree with each other.
This post does the opposite of guessing. Below is a percentile table where every row says where its number came from, including the rows where the honest answer is "nobody has published this."
What does the real distribution of typing speeds look like?
The reference dataset is Observations on Typing from 136 Million Keystrokes by Dhakal, Feit, Kristensson and Oulasvirta. Participants transcribed 15 English sentences on their own keyboards. Speed was scored the standard way, five characters counted as one word, timed from the first keypress to the last, which is the same math explained in how WPM is calculated.
Three shape facts come straight out of the paper:
- The mean is 51.56 WPM, with a standard deviation of 20.20.
- The distribution is not normal. It has a skewness of 0.513 and a kurtosis of -0.11, meaning it leans right with a longer tail on the fast side than the slow side.
- The fastest participants reach 120 WPM or more. The paper puts no ceiling on that tail.
The standard deviation is the part most percentile charts quietly ignore. A spread of 20 WPM around a mean of 52 means the typical person is nowhere near the average. The band from 26 to 78 WPM holds 80% of everyone measured. Inside a range that wide, a five-WPM difference barely moves your rank at all, which is why a chart claiming 61 WPM is the 71.4th percentile is selling precision that the underlying data cannot support.
If you want the plain-English version of where the middle sits, what is a good typing speed covers the average and the job standards side by side.
What WPM puts you in the top 10%, 5%, 1%?
Here is the band table. The third column is the important one.
| Percentile | Approx. WPM | Where the number comes from |
|---|---|---|
| 10th | ~26 | Reported directly. The paper defines slow typists as the slowest 10%, "less than approx. 26 WPM in our data" |
| 25th | ~38 | Derived from the published mean (51.56) and SD (20.20). Approximate |
| 50th (median) | ~50 | Derived. Slightly below the mean because the curve leans right |
| Mean (not a percentile) | 51.56 | Reported directly |
| 75th | ~65 | Derived from the published mean and SD. Approximate |
| 90th | ~78 | Reported directly. Fast typists are defined as "higher than that of 90% of participants (above approx. 78 WPM)" |
| 95th | ~90 | Inferred. The fastest decile averaged 89.56 WPM, so the midpoint of that decile lands near 90 |
| 99th | Not reported | The paper states only that the fastest reach "120 WPM or more" |
Source: Dhakal, Feit, Kristensson and Oulasvirta, Observations on Typing from 136 Million Keystrokes, CHI 2018, Table 3 and the Typist Groups section. Bold rows are figures printed in the paper. The others are arithmetic on published figures, and the paper explicitly notes the distribution is not normal, so treat the derived rows as bands of several WPM rather than points.
Two things follow from that table that you will not see stated elsewhere.
The top 10% is a wide country, not a village. The fastest decile averaged 89.56 WPM with a standard deviation of only 9.53. So once you cross about 78 WPM, you are in a group whose members mostly sit between roughly 80 and 100 WPM. Crossing that line is the meaningful event. Climbing inside it changes your percentile very little.
The bottom decile is tightly packed too. The slowest 10% averaged 20.91 WPM with a standard deviation of 4.05. That is a narrow band, which means small absolute gains at the low end move your rank fast. Going from 25 to 35 WPM shifts you further up the ranking than going from 85 to 95 does.
The 99th percentile is genuinely unpublished. Any site quoting you a specific 99th-percentile WPM figure is filling a gap in the research with a number they made up. The honest statement is that it sits somewhere above 100 WPM, and the largest study on record declines to pin it down.
Why do typing-site percentiles skew high?
Every percentile is a percentile of something, and the something is usually a bad sample. This applies to the Aalto data too, and the paper says so itself in its limitations section.
Even the good dataset is self-selected. Participants were recruited from the user base of a commercial typing-test site. The reported demographics: mean age 24.5 (SD 11.2), with 75% aged 11 to 30, 68.05% from the United States, and 72% having taken a typing course. That is a sample of people who were already interested in typing, sitting down to be measured on typing. Their median is higher than the general adult population's would be.
Leaderboards rank attempts, not people. A public leaderboard shows best scores. If someone takes forty tests and posts their best one, that score is not their typing speed, it is the top of their range. Compare that against your single honest attempt and you lose by construction. The Aalto study avoided this by scoring every participant on one fixed set of 15 sentences, first attempt, with a documented exclusion rule that dropped about 12% of sessions for excessive errors or obvious distraction.
Test format quietly changes the number. Random common-word drills score higher than real sentences with punctuation and capitals. A 60-second sprint scores higher than a five-minute effort. Gross WPM scores higher than net. None of these are cheating, but a percentile built on one format and applied to a score from another is meaningless. This is the same reason your WPM differs on every typing test.
Almost nobody publishes their N or their method. When a percentile tool cannot tell you how many people it measured, over what text, at what test length, and whether errors were deducted, the percentile is decoration.
How do age and practice shift the curve?
Start with what the research does not say. The Aalto paper publishes no WPM-by-age table, and given a sample with three quarters of participants aged 11 to 30, it could not support one credibly. Every age-bracket typing chart circulating online is therefore built on something other than this dataset, and none of them name what.
What the paper does report about who ends up where:
- Formal training moves the mean about 5 WPM. Trained typists averaged 54.35 WPM, untrained typists 49.00. Statistically significant on a sample this size, but the effect size is small (Cohen's d = 0.27), and both groups had a standard deviation near 20. Having taken a typing course shifts you barely a quarter of one standard deviation.
- Finger count correlates, weakly. Participants reported using 6.95 fingers on average. The fastest decile reported 8.40, the slowest 5.30. The correlation with speed is 0.34.
- Rhythm correlates far more strongly than either. Rollover, meaning pressing the next key before releasing the previous one, correlates with speed at r = 0.73. Fast participants used rollover on 40 to 70% of keypresses. Across all participants the average rollover ratio was 25%.
Read together, those three lines say something useful about moving your own percentile. The thing most strongly associated with being in the fast group is not a childhood typing class and not a specific finger assignment. It is smooth overlapping motion between key pairs, which is a trainable rhythm. That is the mechanism behind the drills in how to get to 80 WPM, and it is why practising real sentences beats practising isolated letters.
Accuracy travels with it rather than trading against it. The average uncorrected error rate was 1.167%, and 90% of participants left under 2.66% of errors in their text. The fastest group left fewer errors than the slowest, not more.
How should you use a percentile, and how not to?
Use it as a coarse band that tells you which problem you have.
- Below about 38 WPM (bottom quarter): you are probably still locating keys visually. Technique work pays back faster here than anywhere else. Is 40 WPM good covers what that threshold actually gets you.
- Around 50 WPM: you are mid-distribution. Most office work is comfortable, and the next real jump is consistency rather than peak speed.
- Around 65 to 78 WPM: upper quarter, closing on the top decile. Is 60 WPM good sets out what this range is worth in practice.
- Above 78 WPM: top 10%. Typing has stopped being your bottleneck.
Now the ways a percentile misleads you.
Do not put a percentile on a resume or an application. No employer asks for one. Job postings state thresholds instead, usually a WPM number with an accuracy floor. The federal proficiency standard published in the OPM General Schedule qualification standards is a good example of the shape these requirements take. Typing speed requirements for jobs walks through the common ones by role.
Do not read a percentile as a talent verdict. It is a snapshot of one sample on one day, and the sample was other people who chose to take a typing test.
Do compare yourself to yourself. A rank against strangers on an unknown sample tells you less than your own number last month. That is the comparison that responds to practice.
Frequently asked questions
What percentile is 70 WPM?
Somewhere in the low-to-mid 80s, and the honest answer is that nobody has published the exact figure. What is published: 70 WPM sits above the derived 75th percentile (65 WPM) and below the directly reported 90th percentile (78 WPM). So you are comfortably in the top quarter and not yet in the top tenth. Any site quoting you "70 WPM is the 83.2nd percentile" is inventing the decimal.
Is anyone really typing 150 WPM?
At the far tail, yes, but it is rare and it usually is not what it looks like. The Aalto dataset only states that its fastest participants reached "120 WPM or more," and it does not report a maximum. Scores well above that generally come from short bursts on familiar or repeated text, on word-list formats rather than real sentences, measured gross rather than net. A sustained 150 WPM on unseen prose with punctuation is a different and much rarer thing than a 15-second peak.
Why do different sites give different percentiles?
Because they are ranking you against different populations, using different test formats, with different error handling, and almost none of them disclose any of the three. One site's pool may be its own returning users, who are faster than average by definition. Another may be applying a rule of thumb with no dataset behind it at all. Before you trust a percentile, ask what sample it came from. If the page cannot answer that, the number is decorative.
Does percentile matter to employers?
No. Employers hire against thresholds and accuracy, not rankings. The U.S. Department of Labor's O*NET profile for data entry keyers lists no WPM figure at all among the occupation's abilities, while 88% of respondents rate being exact or accurate as extremely important. That is the pattern across keyboard-heavy roles: hit the posted number, hold high accuracy, and be able to show it. A percentile is not showable. A dated result with a reference someone can check is, which is what a verified typing certificate is for.
Find your own number first
A percentile is only as good as the score you feed it. Take the 1-minute WPM test, then take it twice more and use the middle score rather than your best one. Your results history is stored on your own device, so you can watch the trend over weeks instead of arguing with a stranger's chart about which decile you belong to. The trend is the number that actually responds to practice.
Sources
- Vivek Dhakal, Anna Maria Feit, Per Ola Kristensson and Antti Oulasvirta, Observations on Typing from 136 Million Keystrokes, CHI 2018, Aalto University and University of Cambridge. Mean 51.56 WPM (SD 20.20), 10th percentile approx. 26 WPM, 90th percentile approx. 78 WPM, fastest decile mean 89.56 WPM (SD 9.53), slowest decile mean 20.91 WPM (SD 4.05), skewness 0.513, kurtosis -0.11, 136,857,600 keystrokes from 168,960 participants. The full paper PDF carries the demographics and limitations quoted above.
- U.S. Department of Labor, O*NET OnLine profile for Data Entry Keyers (43-9021.00). Abilities, work context and accuracy ratings.
- U.S. Office of Personnel Management, General Schedule Qualification Standards for Clerical and Administrative Support Positions. Federal typing proficiency requirements.